
Three parts, one year. Part 1: agreeing on what’s real. Part 2: the value of a reconciled rollup. Part 3: the hand-built forensic spreadsheet.
The Loop All Operations Run On
SensorUp spent that year alongside the operator’s team, watching the work in Parts 1 through 3 get done by hand. We worked with them as they reconciled their records, built their emissions inventories and assembled the data for root cause analysis one event at a time.
That is how we found the loop every emissions event runs through. First, catch the real signal out of the noise. Second, prioritize that signal against your operating plan. Third, resolve the signal to the team that owns the fix. The record carries the data through all three.
We noticed that every operator runs this loop in some way, across all their operations, not just in methane. The loop runs slowly because the data those teams need is cross-functional. It lives in another team’s dashboard, login, inbox, and spreadsheets, and it takes a lot of time to pull it together.
We built SensorUp Studio, so the loop runs as a system formed to each operator. Your system should adapt to your operational advantages, changing assets, new vendors and divestitures, because when the system cannot, the work gets done by hand.
Part 3 described the spreadsheet. That spreadsheet was the blueprint for the field tool we built.
How SensorUp Studio changes how you work
| What got done by hand last year | What SensorUp does today |
|---|---|
| Reconciles detections against a drifting asset registry, pruning divested sites, and excluding gas that belongs to a partner | Applies attribution rules once and continuously against the asset registry you already maintain |
| Weights detections by hand as they come in, source by source | Weights detections by source automatically, instead of treating every alert the same |
| Builds the emission inventory and the lists of priority repairs and equipment upgrades by hand | Keeps the priority list current, so nobody waits for someone to assemble it |
| Hand-stitches flyover, satellite, OGI, work orders, and SCADA into one root-cause narrative | Attaches evidence and data to the event automatically, so analysts start at interpretation, not information gathering |
| Keeps corrective rules in a spreadsheet cell, like a shut-in threshold typed into it | Triggers the rules, routes them to an owner, and closes out on the record, with a person approving the automated action |
| Reassembles the audit story from scratch each assurance cycle | Builds the per-event, per-asset trail as the work happens, so the file answers before the auditor finishes the question |
Read more on how Studio works on the SensorUp Studio page.
Built by being on the ground, next to the operator
Part 2 showed where the loop slows down, the handoff between the insight and the instruction. The amount of time it takes to assemble the data means true analysis and insight arrives too late to prioritize it. SensorUp Studio enables teams to assemble the right data to prioritize the work. Detections get evaluated, the evaluation directs field action, and then the action goes on the record. The data lineage stays intact the whole way.
The finding
After a year with SensorUp, this operator’s methane detections fell by 66%.
Two things drove the fall in methane detections. The operator recognized repeat signals and fixed the sites they kept coming from. And reconciled asset records cut the false alarms from gas the operator did not need to worry about.
Getting there costs too much time for most teams. Data assembled event by event, in spreadsheets one or two people keep alive. Studio makes the loop repeatable across your teams, so the first, second and tenth team start where the others finished.
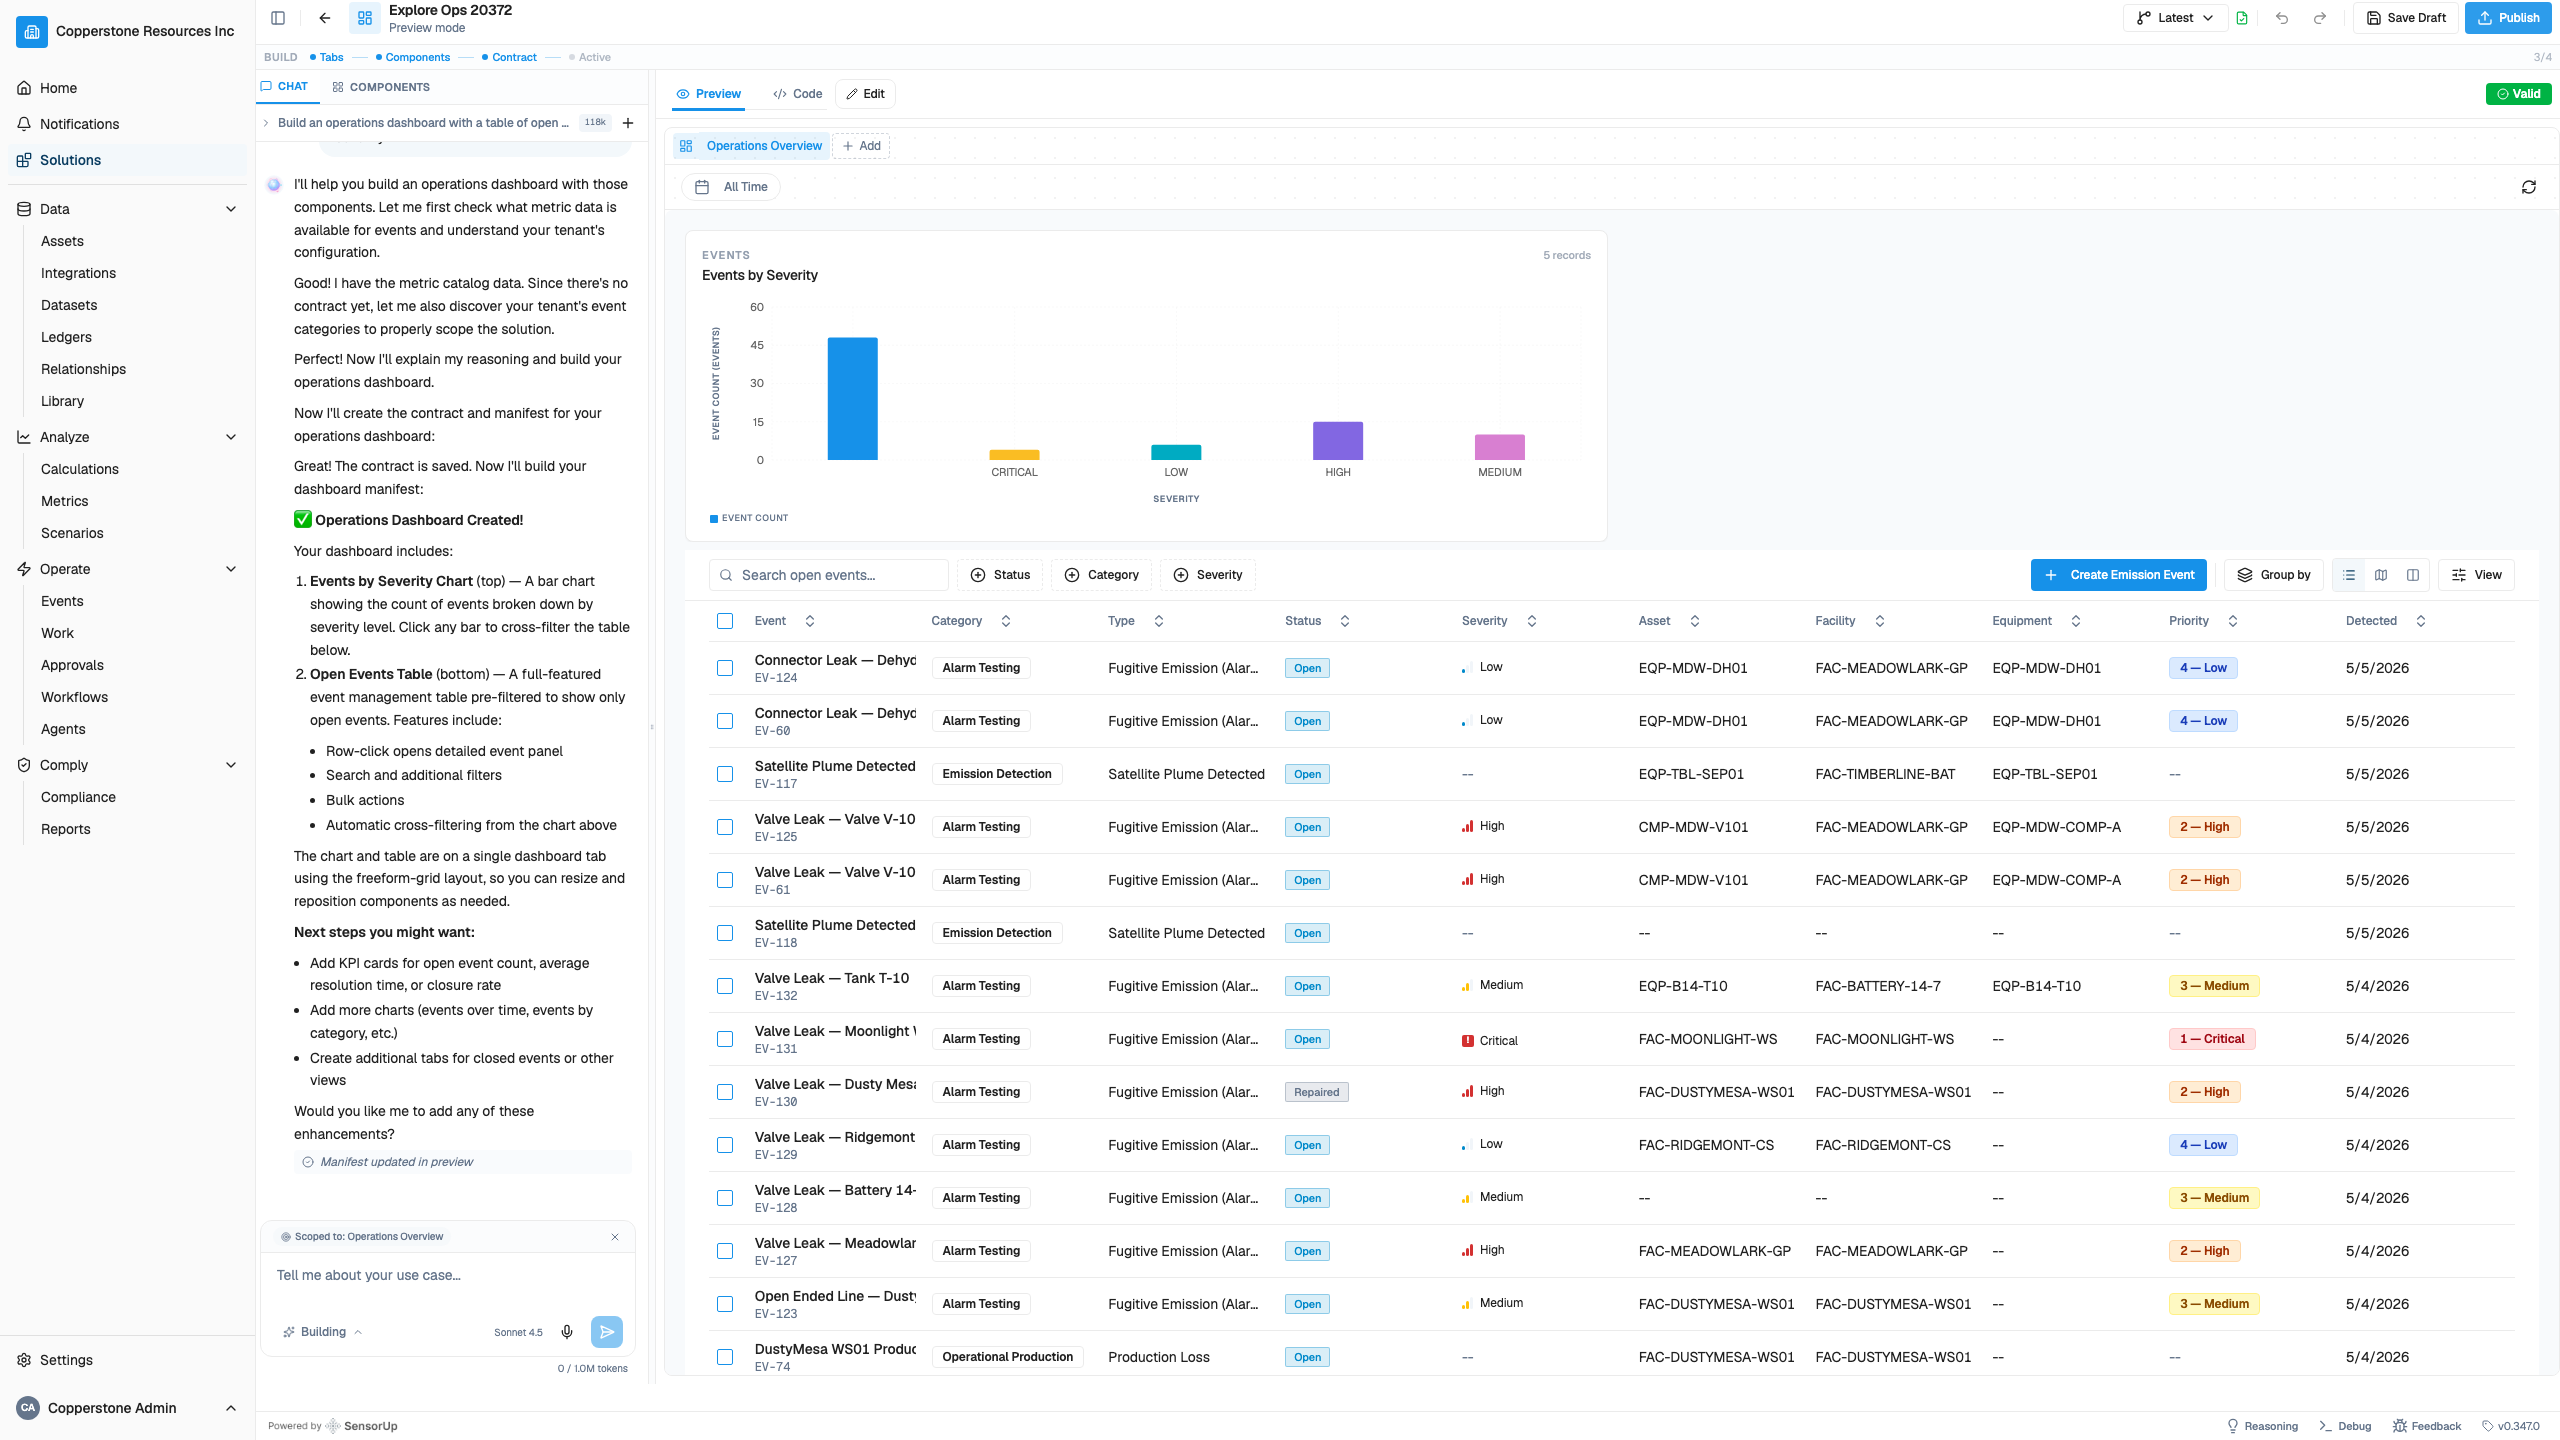 Open events ranked against severity with each one tied to its asset and facility. SensorUp Studio on a demo environment.
See what this looks like on your data, in two days
The loop in this series took a year to assemble. In a SensorUp Studio workshop, it runs on your data in two days.
Bring your detection feeds, your asset list, and one workflow. You leave with a working prototype running the loop on your own operation: catch, prioritize, resolve.
You spend the two days building against your own problem. What works at the end of it runs on your operation, not on a demo of somebody else’s.